Visualizing Network Topologies
Posted on Sat 19 April 2025 in network, topology, visualization, javascript, vibe coding
While preparing my classes on interconnection networks in computer systems, I wanted to better understand metrics related to ring topologies. To explore this, I created a simple JavaScript program to visualize a ring network, using “vibe coding”—an approach where you let Artificial Intelligence (AI) generate the code for you. The result is this Ring Network Visualization (GitHub repository).
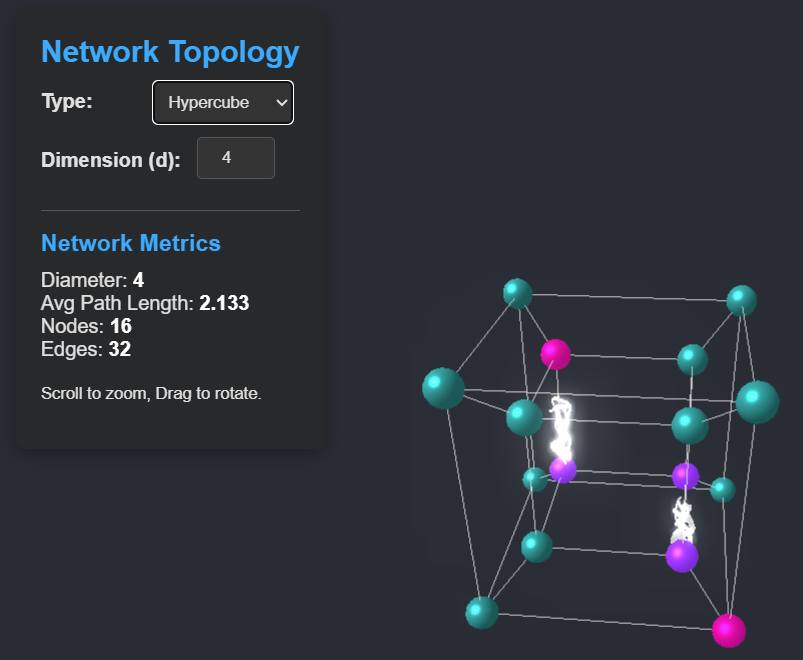
Later, I came across several impressive visualizations built with Three.js (like this and this), and I wanted to give it a try. Using the same “vibe coding” approach, I developed this Topology Visualizer (GitHub repository). It’s a simple tool that allows you to visualize different network topologies—such as ring, mesh, and hypercube—in 3D. You can change the number of nodes and observe how the topology evolves. Clicking on a node triggers a visual effect that shows light bolts connecting it to the farthest node, effectively highlighting the diameter of the topology.